

Properly monitoring a cloud infrastructure is essential to guarantee the performance, availability and stability of services. In environments deployed on Oracle Cloud Infrastructure (OCI), having reliable metrics allows you to detect anomalies, identify bottlenecks, and anticipate potential incidents before they impact users.
Oracle Cloud Monitoring is OCI’s service designed to collect and query metrics from cloud resources, set alarms, and analyze infrastructure behavior. These metrics provide information about CPU, memory, storage, network, and other essential components of the environment.
In this article, we look at the key metrics of Oracle Cloud Infrastructure, what insights they provide, and which ones are especially relevant for monitoring the performance of an OCI infrastructure.
What is Oracle Cloud Monitoring?
Oracle Cloud Monitoring is an Oracle Cloud Infrastructure service that allows you to collect, query, and visualize metrics related to resources deployed in OCI.
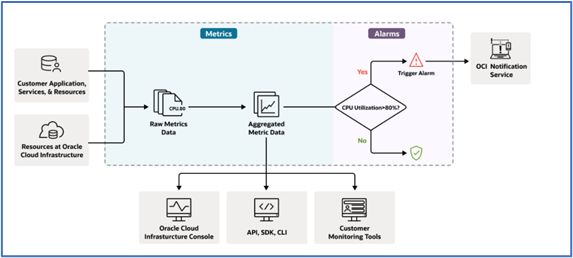
In the case of Oracle Cloud Infrastructure (OCI), it offers us a series of tools to be able to carry this out. Specifically, a series of metrics of vital importance for business activity can be passively or actively monitored .
The metrics allow you to know the status and behavior of different cloud resources in practically real time. From this data, technical teams can set thresholds and set alarms to receive notifications when certain conditions are met.
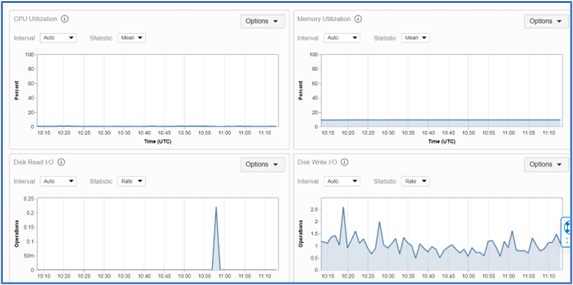
Monitoring is not only about observing whether a resource is active. Metric analysis allows you to identify anomalous trends and behaviors, for example:
- Sustained increases in CPU consumption.
- Lack of storage capacity.
- Increased network latency.
- Unexpected increases in entry and exit operations.
- Saturation of certain resources.
- Abnormal variations with respect to usual behavior.
OCI Monitoring is therefore one of the fundamental pieces to maintain operational control of an infrastructure deployed in Oracle Cloud.
By default, the metrics they typically cover are, to mention the most important, CPU, memory, disk read/write on compute instances, packet sending, and session state on networking instances.
Oracle, on the other hand, offers us a fairly complete notification service in the event that the metrics exceed a previously defined limit.
To get the most out of it, Oracle offers within its CLI (command line interface) a series of end-points that together with the syntax of Monitoring Query Language (MQL) we can integrate our own monitoring tool giving added value, since it can be adapted and integrated to the current needs for daily monitoring.
What metrics can be monitored in Oracle Cloud Infrastructure?
The available metrics depend on the OCI service and resource being used. Among the most relevant are those related to Compute, storage, networking, and databases.
Analyzing these metrics together is especially important, as a performance issue does not always originate from the resource that initially exhibits symptoms.
Compute metrics
Oracle Cloud Infrastructure Compute instances generate different metrics related to the usage of your resources.
One of the most relevant metrics is CPU Utilization, which indicates the percentage of CPU capacity used by an instance.
Sustained high consumption may indicate that an instance needs more throughput, or that there is a process that is using resources abnormally.
In addition to CPU, it is important to analyze other metrics related to:
- Memory utilization.
- Network traffic.
- Disk operations.
- Throughput.
- Latency.
- Errors.
For example, high CPU utilization accompanied by increased disk operations may point to a different problem than we would encounter if the CPU increase were caused exclusively by application processes.
For this reason, Oracle Cloud Monitoring should be used to analyze the aggregate behavior of different metrics and not just an isolated indicator.
Storage metrics
Storage is another component that must be continuously monitored in an OCI infrastructure.
Among the metrics that may be relevant are:
- Capacity used.
- Reading and writing operations.
- IOPS.
- Throughput.
- Latency.
- Input and output errors.
Capability allows you to detect situations where a resource is approaching its storage limits, while IOPS, throughput, and latency help analyze its behavior from a performance standpoint.
For example, an increase in storage latency can end up affecting an application’s response time even if the instance’s CPU utilization remains within the usual range.
Network metrics in OCI
Connectivity is another critical element within any cloud architecture.
Oracle Cloud Infrastructure can analyze different metrics related to network traffic and the behavior of connected resources.
These include:
- Incoming and outgoing traffic.
- Packages sent and received.
- Errors.
- Throughput.
- Latency.
- Use of network interfaces.
These metrics allow you to identify connectivity issues, unexpected increases in traffic, or situations where certain infrastructure components may be reaching their limits.
In complex architectures, network analysis is especially relevant when there are connections between different virtual networks, cloud services, corporate data centers or hybrid environments.
Database metrics
Databases are another component where monitoring is especially important.
Depending on the service used in OCI, metrics related to the following can be analyzed:
- CPU utilization.
- Memory.
- Sessions.
- Entry and exit operations.
- Storage.
- Latency.
- Throughput.
- Connection activity.
Analyzing these metrics together can determine whether a performance degradation is related to the database itself, the infrastructure that supports it, or other components of the architecture.
At this point, it is especially important to establish reference values for each environment. A metric that may be considered normal in one workload may be problematic in another.
Which OCI metrics should you monitor?
Not all metrics are equally important for all architectures.
An appropriate Oracle Cloud Monitoring strategy should start by identifying critical resources and selecting those metrics that provide insight into their availability, capacity, and performance.
In general, we can establish four large groups:
| Area | Priority metrics | What are they for? |
|---|---|---|
| Compute | CPU, memory | Detect overload |
| Storage | IOPS, Capacity, Latency | Detect bottlenecks |
| Network | Traffic, errors, latency | Identify connectivity issues |
| Database | CPU, Sessions, I/O | Monitor performance |
The key is not to collect as many metrics as possible, but to select those that allow operational decisions to be made.
How to build a command for monitoring a parameter?
As an example, we’re going to show you how to construct a command for monitoring a simple parameter, such as the state of a Compute instance.
In the OCI console, within the instance we want to monitor, we access the Metrics section and select the corresponding Metric Namespace . In this case, oci_compute_infrastructure_health.
Once the metric has been selected, from Options we can select Copy Query (MQL). OCI will generate the corresponding query, which we can later use to query the metric.
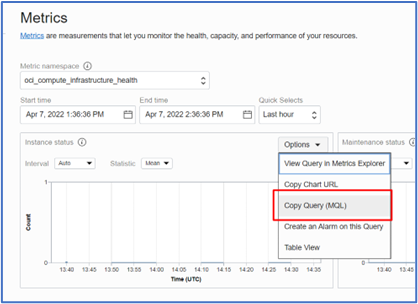
This will have copied a text like the following:
instance_status[5m]{resourceId=”ocid1.instance.oc1.eu-frankfurt-1.. o7a”}.mean()
Within the OCI command structure we use the monitoring parameter and metric-data summarize-metrics-data.

The complete construction would be as follows:
oci monitoring metric-data summarize-metrics-data –compartment-id ocid1.compartment.oc1.. uaq –namespace oci_compute_infrastructure_health –query-text=’instance_status[5m]{resourceId=”ocid1.instance.oc1.eu-frankfurt-1.. o7a”}.mean()’The result is a JSON output parameterized in such a way that we can extract the information that interests us:
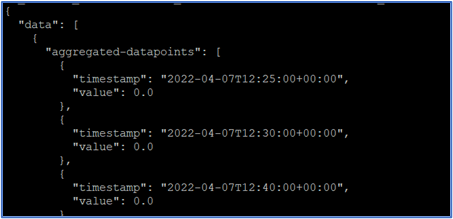
In this case, the “value” variable indicates 0.0 indicating that the instance is available.
This shows how we can monitor the health of a compute instance, but the possibilities are quite wide. In fact, almost any Oracle cloud service offers the possibility of being monitored through the CLI such as load balancers, IPSEC tunnels, Fast Connect, Autonomus Database etc.
Oracle Cloud Monitoring and Alarms
One of the main benefits of OCI monitoring is that the metrics can be used to set alarms.
An alarm allows you to define a certain condition on a metric. When the configured threshold is reached, OCI can generate a notification so that the responsible team can analyze the situation.
For example, an alarm can be configured to detect CPU utilization above a certain percentage over a period of time.
However, setting alarms is not simply about defining arbitrary thresholds.
A value that is too low can lead to a high number of false alarms, while a value that is too high can cause an incident to be detected too late.
Therefore, it is advisable to set the thresholds based on the usual behavior of each resource and periodically review its configuration.
Zabbix/Grafana integration
OCI Monitoring can be part of a broader monitoring strategy and, depending on the needs of the IT team, the data can be integrated or visualized using third-party tools such as Zabbix or Grafana.
| Tool | Main Utility |
|---|---|
| OCI Monitoring | Native Metrics Collection and Monitoring |
| Zabbix | Centralized monitoring of heterogeneous infrastructures |
| Grafana | Visualization and creation of dashboards |
So,in order for this data to be useful to us, and to be able to represent it in a comfortable way and to be able to monitor it correctly, we can integrate this data into any monitoring platform, in our example below, we will use Zabbix.
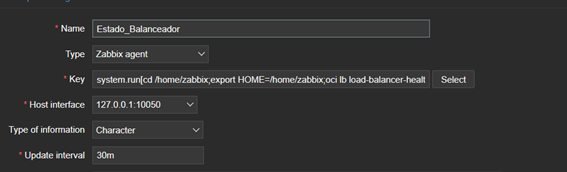
Zabbix can natively process commands and filter the results. In our case, we are interested in keeping only the status of the balancer if it is OK or ERROR, for that Zabbix offers us a quick way to filter structured data in JSON files as shown below:

Once the status of the balancer has been linked to the data and choosing a query interval, we will have incorporated the value to be able to create alert triggers to warn us in the event that the balancer instance is not available.
This case that we have seen can be extended to all the instances that we have in the Oracle OCI, creating a single, fast and accessible platform to review the health of our infrastructure in OCI.
In the event that we want to increase our visual experience, we can benefit from Grafana, a data visualization tool that is very integrated today in this field.
There are Grafana plugins that allow us to connect directly to the metrics of any OCI instance, and to be able to visualize time series.
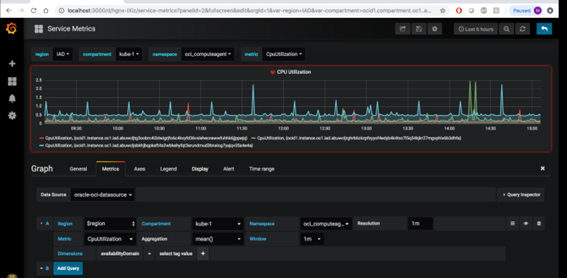
Thanks to the facilities provided by Oracle through CLI and its integration with other tools, we can manage the metrics of our infrastructure in a simple and reliable way.
The applications and physical components that run at the customer’s layer are of vital importance for business continuity and with this type of tools availability is guaranteed, and predict or avoid possible scenarios that lead to service unavailability.
Monitoring vs. Observability in OCI
Although the concepts are related, monitoring and observability are not exactly the same.
Monitoring allows you to know the status of certain resources through metrics and alarms.
Observability provides a broader view of the behavior of systems, combining different sources of information to understand why a certain behavior occurs.
In an OCI environment, metrics can be complemented with other observability services and capabilities, such as logs, events, and traces, for deeper analysis.
For example, a metric might show that a service’s response time has increased. From that data, logs and other observability elements can help determine what the specific cause is.
Therefore, Oracle Cloud Monitoring should be understood as a part of a broader Oracle Cloud Infrastructure observability strategy.
Best Practices for Monitoring Oracle Cloud Infrastructure
Effective monitoring requires more than just activating metrics.
1. Identify critical resources
Not all components of an architecture have the same impact on the business. It is advisable to first identify those resources whose unavailability or degradation may affect critical applications and services.
2. Define a baseline
Before setting alarms, it is advisable to know what the usual behavior of each resource is.
The baseline allows differentiating a normal variation from a truly anomalous behavior.
3. Set up relevant alarms
Alarms must be linked to situations that require action. Setting up too many alerts can lead to alert fatigue and cause relevant issues to go unnoticed.
4. Analyze trends
An isolated metric provides limited information. Analysing their evolution over time makes it possible to detect progressive increases in consumption and anticipate capacity problems.
5. Correlate Different Metrics
A CPU increase, for example, should not be analyzed independently.
Relating it to memory, disk, network, or database metrics can help identify the actual source of a degradation.
6. Integrate monitoring with operations strategy
Monitoring should be part of IT operating procedures. An alarm is only useful if there is a defined process to analyze and act on it.
Why is it important to monitor OCI?
A cloud infrastructure can function well for long periods of time and still experience significant variations in consumption and performance.
Continuous monitoring allows you to move from a reactive model to a more preventive one.
Among its main benefits are:
- Increased availability: Allows you to detect issues before they cause a service interruption.
- Better performance: Makes it easier to identify bottlenecks.
- Resource optimization: Helps detect oversized or underutilized resources.
- Early detection of incidents: alarms allow you to act on anomalous behaviour.
- Capacity planning: Historical analysis helps anticipate future needs.
- Increased visibility: Provides a centralized view of OCI resource behavior.
Conclusion
Monitoring is an essential component to successfully manage any infrastructure deployed on Oracle Cloud Infrastructure.
Oracle Cloud Monitoring allows you to collect and analyze metrics from different OCI resources, set alarms, and have information that makes it easier to detect performance, capacity, and availability issues.
However, an effective monitoring strategy is not about looking at all available metrics. The real value is in identifying critical indicators, establishing baselines, setting up relevant alerts, and correlating information from different components.
As cloud architectures become more complex, combining metrics with logs, events, and other observability capabilities allows for a much more complete view of the environment and improves the ability of IT teams to detect and resolve incidents.
In this context, having the right Oracle Cloud Infrastructure monitoring strategy is key to maintaining stable, efficient, and growth-ready OCI environments.